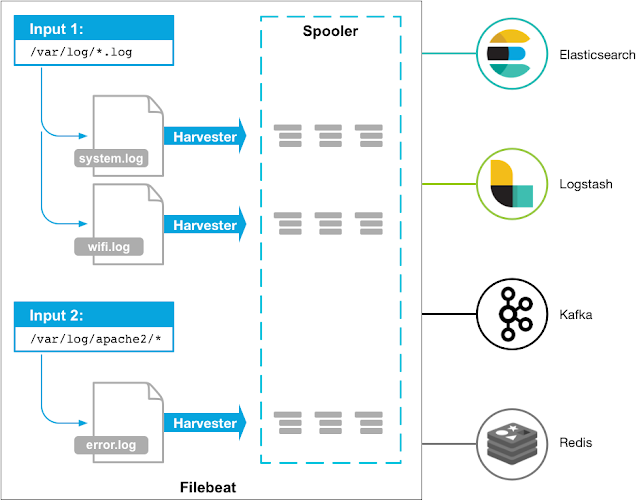
Analyse log using plug and play FileBeat
ELK-B stack is one of the powerful frameworks for log analysis which helps to draw important business decisions and helps evolve ALM.
There are few ways to inject data in Elasticsearch for analysis
- Writing data using REST API
- Using available frameworks(Serilog, NLog, etc) that have an abstraction layer and does all the REST calls behind the scene for you.
While changing code is the most popular method but it may not be always possible/viable, also sometimes you do not have access to the environment and all you have is the log files in one format or another.
Filebeat is another powerful plugin in the ELK-B stack that can help you analyze logs without changing code, all you need to do is download FileBeat and unzip the file.
- Once you have extracted the content open filebeat.yml and under filebeat.inputs: of filebeat.yml locate paths:
paths maintains list of folders or docker path that will contain logs:-
paths:
- C:\ProductService\logs\*
- C:\InventoryService\logs\*
2. Under filebeat.yml locate output.elasticsearch: and add below to configure a new index and Elasticsearch for storing the logs.
output.elasticsearch:
hosts: ["localhost:9200"]
index: "folderlogging"
setup.template.name: "folderlogging"
setup.template.pattern: "folderlogging-*"
setup.ilm.enabled: false
setup.ilm.policy_name: "Standard-Index"
3. Open command prompt and point to the extracted folder, then execute following command.
filebeat.exe -e -c filebeat1.yml
4. Whenever a file arrives/changes in one of the configured folders it Filebeat will send a log to a configured instance of Elasticsearch which can then be viewed in Kibana.

5. Now you can use Kibana to create visual dashboards using the data segregated in Elasticsearch.
Unless you have infinite memory you would like to delete data from the index based on the time period which can be done using the query below:-
POST myindex/_delete_by_query
{
"query": {
"range" : {
"@timestamp" : {
"gte" : "09/02/2017",
"lte" : "11/02/2017",
"format": "dd/MM/yyyy||yyyy"
}
}
}
}
But deleting data by API not preferred for clearing storage space, you should rather create a time-based index like folderlogging-2021-08-10 instead of folderlogging, Kibana allows creating index patterns like folderlogging-* which would allow you to query all the indexes at once.
Once you have a time-based index created you can Curator to automate deleting indexes more than a certain time period.


Comments
Post a Comment